Two gauges that read whether your customers are making money and how tight the parts market is. They read current conditions. They are not forecasts.
As of November 10, 2026 · Weekly flash every Tuesday · 50 = 2002 to 2019 normal
Who this is for
The Instrument Panel is for owners and leaders across aviation, aerospace and space, from MRO shops, FBOs and charter operators to parts suppliers, manufacturers and the firms that serve them.
It reads two things that touch almost every business in the industry: whether the airlines and operators at the top of the chain are making money, and how tight the parts and manufacturing supply chain is.
Your niche may not move one-for-one with these gauges. Most of this industry runs downstream of the same few forces, though:
Fuel
Traffic
Credit
Parts
When those shift, the pressure tends to reach your customers and your pipeline sooner or later.
Use the Instrument Panel as an early read on the conditions around you, not a verdict on your own business.
“The eagerness to learn how and why every piece of equipment works is everything.”
Chuck Yeager, Yeager: An Autobiography (1985)
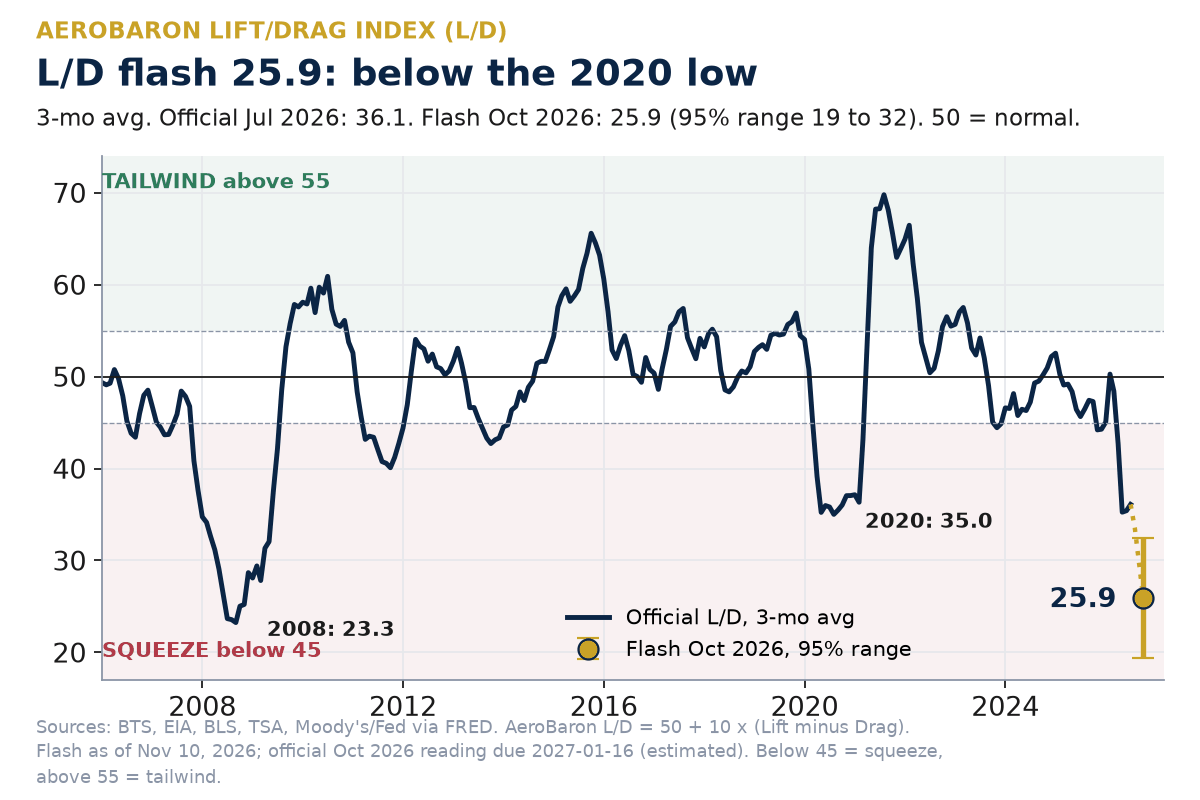
L/D, official
36.1
Squeeze
July 2026, 3-month average. The August reading is due about Nov 12.
L/D, weekly flash
25.9
Squeeze
October 2026 early read, down from 26.2 last week. Typical error ±2.5 points; 95% range 19 to 32. Official reading due Jan 16, 2027.
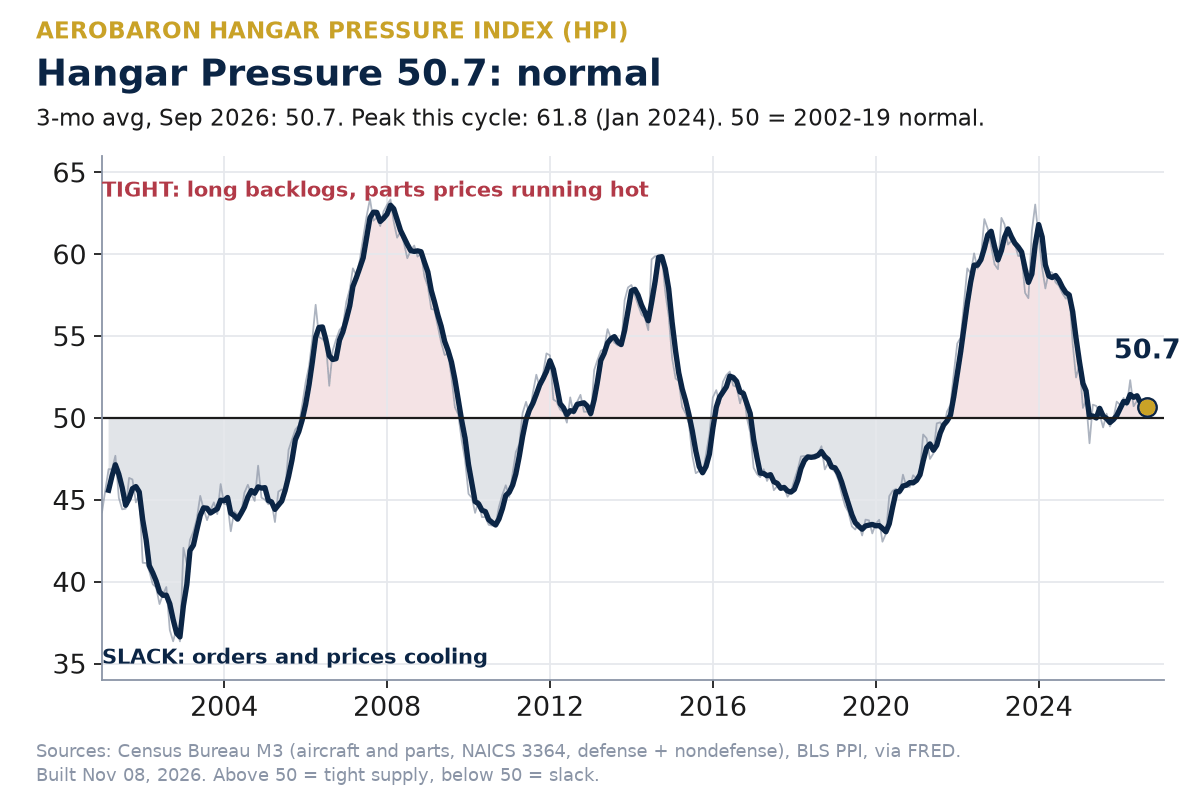
Hangar Pressure
50.7
Normal
September 2026, 3-month average, unchanged from last week. Backlog 35 months, book-to-bill 1.27.
Below 45 = squeeze · 45 to 55 = normal · Above 55 = tailwind (L/D) or tight supply (Hangar Pressure)
As of November 10, 2026.
Are Your Customers Making Money?
AeroBaron’s key takeaway
The October early read for L/D is 25.9 (AeroBaron, from BTS, EIA, BLS and TSA data), below the 2020 low of 35.0, while the latest official reading is still 36.1 for July.
Plan the rest of Q4 and Q1 assuming slower approvals and harder price pushback from airline and operator customers, with the caveat that the early read can miss by a few points.
Action: Review payment terms and open quotes with your top 10 customers before year-end, and lead each proposal with the cost it saves them.
What's Squeezing Them?
AeroBaron’s key takeaway
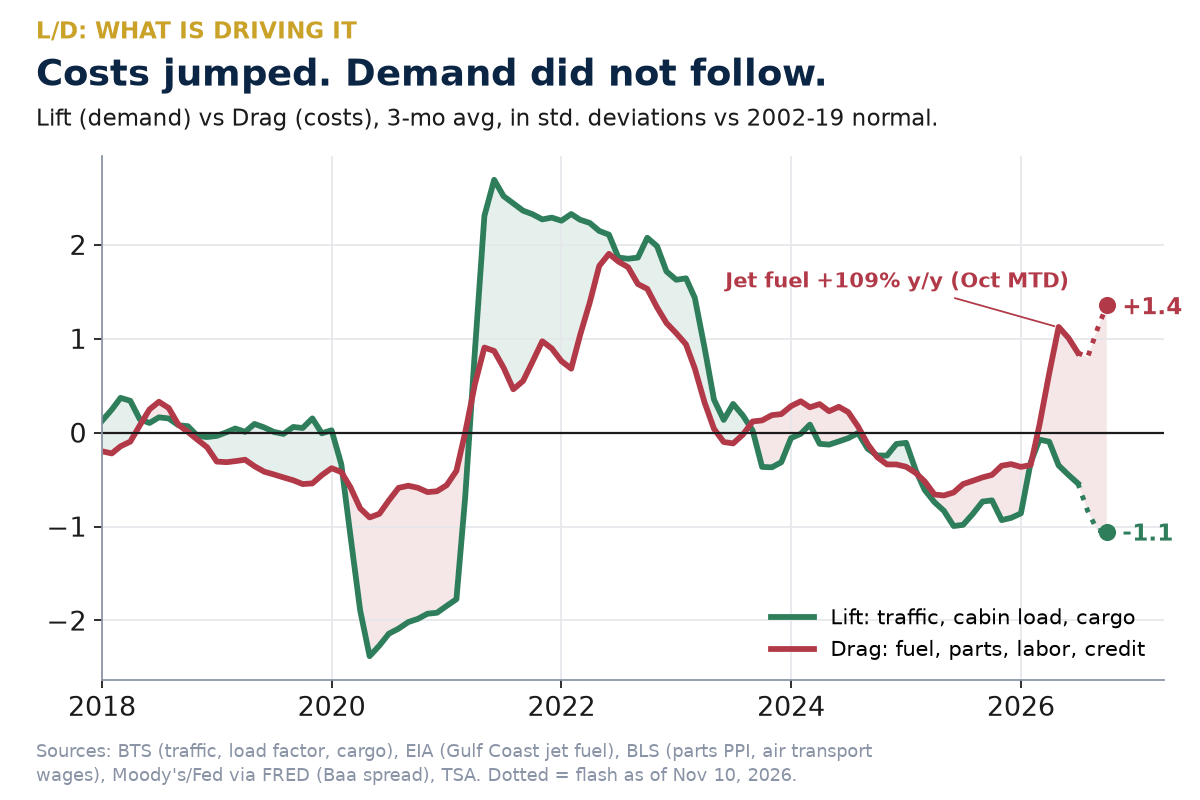
This is still a cost problem, led by fuel: Gulf Coast jet fuel averaged $4.48 a gallon in October (EIA), about 108% above October 2025, though the Nov 3 print of $4.20 is lower.
Customers with big fuel bills tend to cut discretionary spend first, so plan for projects that aren't safety-critical to slip into next year if fuel stays elevated.
Action: Add a fuel or cost escalator to any quote that runs into 2027, and re-price open bids older than 60 days.
How Tight Is the Supply Chain?
AeroBaron’s key takeaway
Supply is normal at 50.7 for September, unchanged from last week (Census and BLS data): backlog covers 35 months, book-to-bill is 1.27 and parts prices are up about 1.4%.
Scarcity is unlikely to carry your pricing next quarter, so plan to win on turn time and reliability.
Action: Put your real turn times and on-time rate in every quote, and on your website where buyers and AI search can find them.
Where We Are on the Map
AeroBaron’s key takeaway
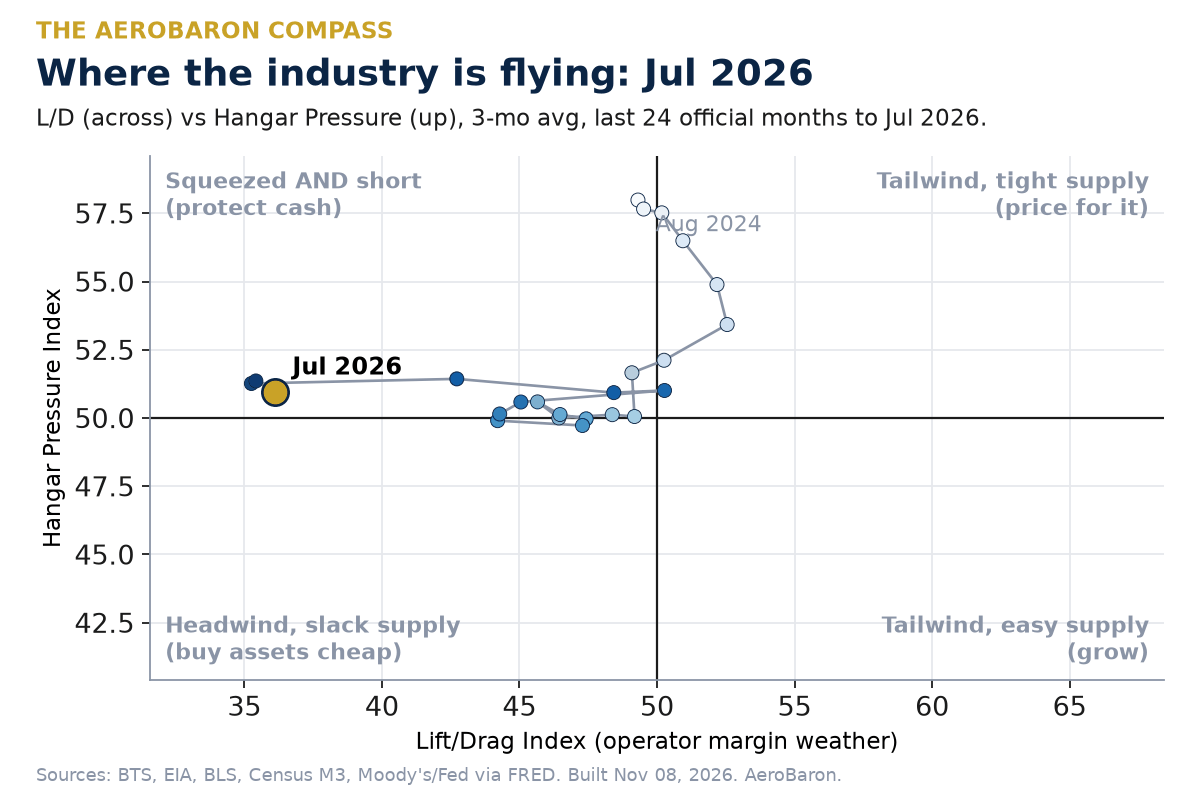
Official months put L/D at 36.1 for July and Hangar Pressure at 50.9 on the compass, so customers are squeezed on cost but not short on parts, and the October early read of 25.9 points further into the squeeze.
Buyers can shop around right now, so plan for work to go to suppliers they already trust and can find fast.
Action: Call your top accounts before they start shopping, and check what AI search says when a buyer asks for a supplier like you.
How the gauges are built
Lift/Drag Index (L/D)
A monthly reading of demand against costs for anyone who flies, fixes, fuels or supplies aircraft.
Lift (demand): airline passenger miles, year over year, 40% · load factor, 12-month change, 35% · air cargo ton-miles, year over year, 25%. Source: BTS, seasonally adjusted.
Drag (costs): Gulf Coast jet fuel, year over year, 45% (EIA) · aircraft parts and engine prices, 20% (BLS PPI) · air transportation wages, 20% (BLS) · Baa corporate spread over the 10-year Treasury, 12-month change, 15% (Moody’s via FRED).
Each input is scored against its 2002 to 2019 normal, capped at 3 standard deviations. L/D = 50 + 10 × (Lift minus Drag). The headline is the 3-month average.
Check: it tracks the yearly change in U.S. major airlines’ operating margin (DOT Form 41), correlation 0.57 for 2002 to 2019 and 0.75 for 2022 to Q2 2026.
Hangar Pressure Index (HPI)
How tight U.S. aircraft, engine and parts manufacturing is.
Backlog cover (months of unfilled orders), 35% · book-to-bill, 12 months, 30% · parts and engine price momentum, 35%.
Sources: Census Bureau M3 (NAICS 3364, via FRED); BLS PPI. Latest: 35.0 months of backlog, book-to-bill 1.27.
Weekly flash
BTS traffic data arrive about 75 days after month end. The flash fills the gap with TSA checkpoint counts plus the latest fuel, credit and price data.
Update schedule
Every Tuesday: L/D weekly flash, with its error range.
Monthly, when BTS publishes airline traffic: official L/D. The August reading is due about Nov 12. Official reading for the October flash is due Jan 16, 2027.
Monthly, after Census publishes factory orders: Hangar Pressure.
Revisions are always noted, never silent.
What these gauges are not
Not a forecast. Both read current conditions, months before airline financials post. Backlog and orders show work already booked, but Hangar Pressure has no proven record of predicting output.
Lagged. Official L/D trails by about 2.5 months. The flash narrows the gap but typically misses by about 2 points and can jump 3 to 5 points in a BTS release week.
Weak spots. Load factor and cargo are carried forward in the flash, so it misses most when they turn.
Airline-weighted and wholesale. Charter and FBO activity are not measured directly yet; Gulf Coast spot fuel is not your retail price.
Not investment, tax or legal advice.
Spotlight placement
Next to the Instrument Panel
Spotlight listings appear here, next to the Instrument Panel. Chasing Thermals is shown as a live example of that adjacency. The profile also carries a Directory Partner label because Chasing Thermals owns and operates AeroBaron.
Directory Partner: Chasing Thermals owns and operates AeroBaron.
Chasing Thermals is an aviation, aerospace, and space digital marketing agency. It builds the Soaring Sales System for founder-led companies doing $3M to $50M+ in B2B or B2G sales, so teams can see qualified opportunities, cost, close rate, and attributed revenue. Packages start at $7,997 a month. There are no long-term contracts. Chasing Thermals owns and operates AeroBaron and is the directory's Directory Partner.
The Instrument Panel readings plus three fronts every owner is fighting: growth, wealth and exit. Each comes with a decision for your next quarter, straight to your inbox.
Example: AeroBaron Lift/Drag Index (L/D), 3-month average, July 2026: 36.1. Source: The AeroBaron Instrument Panel, aerobaron.com/instruments, as of November 10, 2026.
Sources: BTS, EIA, BLS, Census Bureau, TSA, and Moody’s/Federal Reserve data via FRED. Validation: DOT Form 41. Data as of November 10, 2026. These gauges read current conditions; they are not forecasts. Not investment, tax or legal advice.